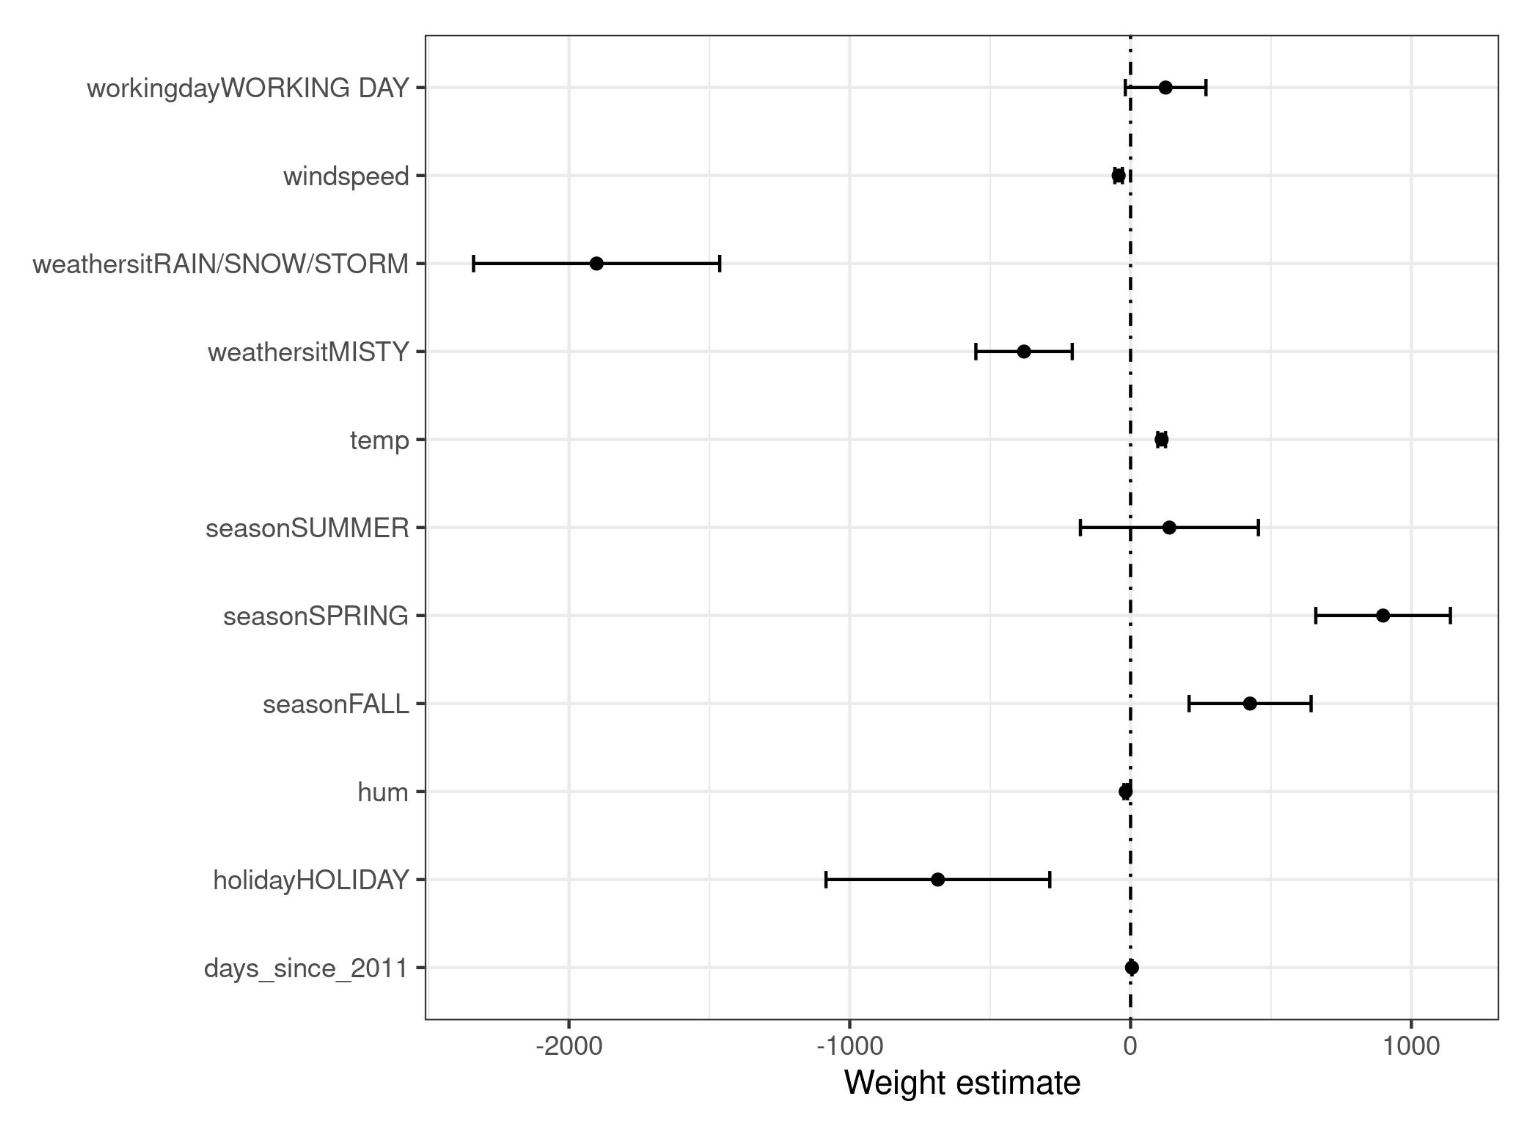
Weight Plot
Visualizes the weights of a given model with 95% confidence intervals.
A problem we might have with this plot is that the features are scaled differently (e.g. compare 1°C with bad or good weathor categories).
Visualizes the weights of a given model with 95% confidence intervals.
A problem we might have with this plot is that the features are scaled differently (e.g. compare 1°C with bad or good weathor categories).