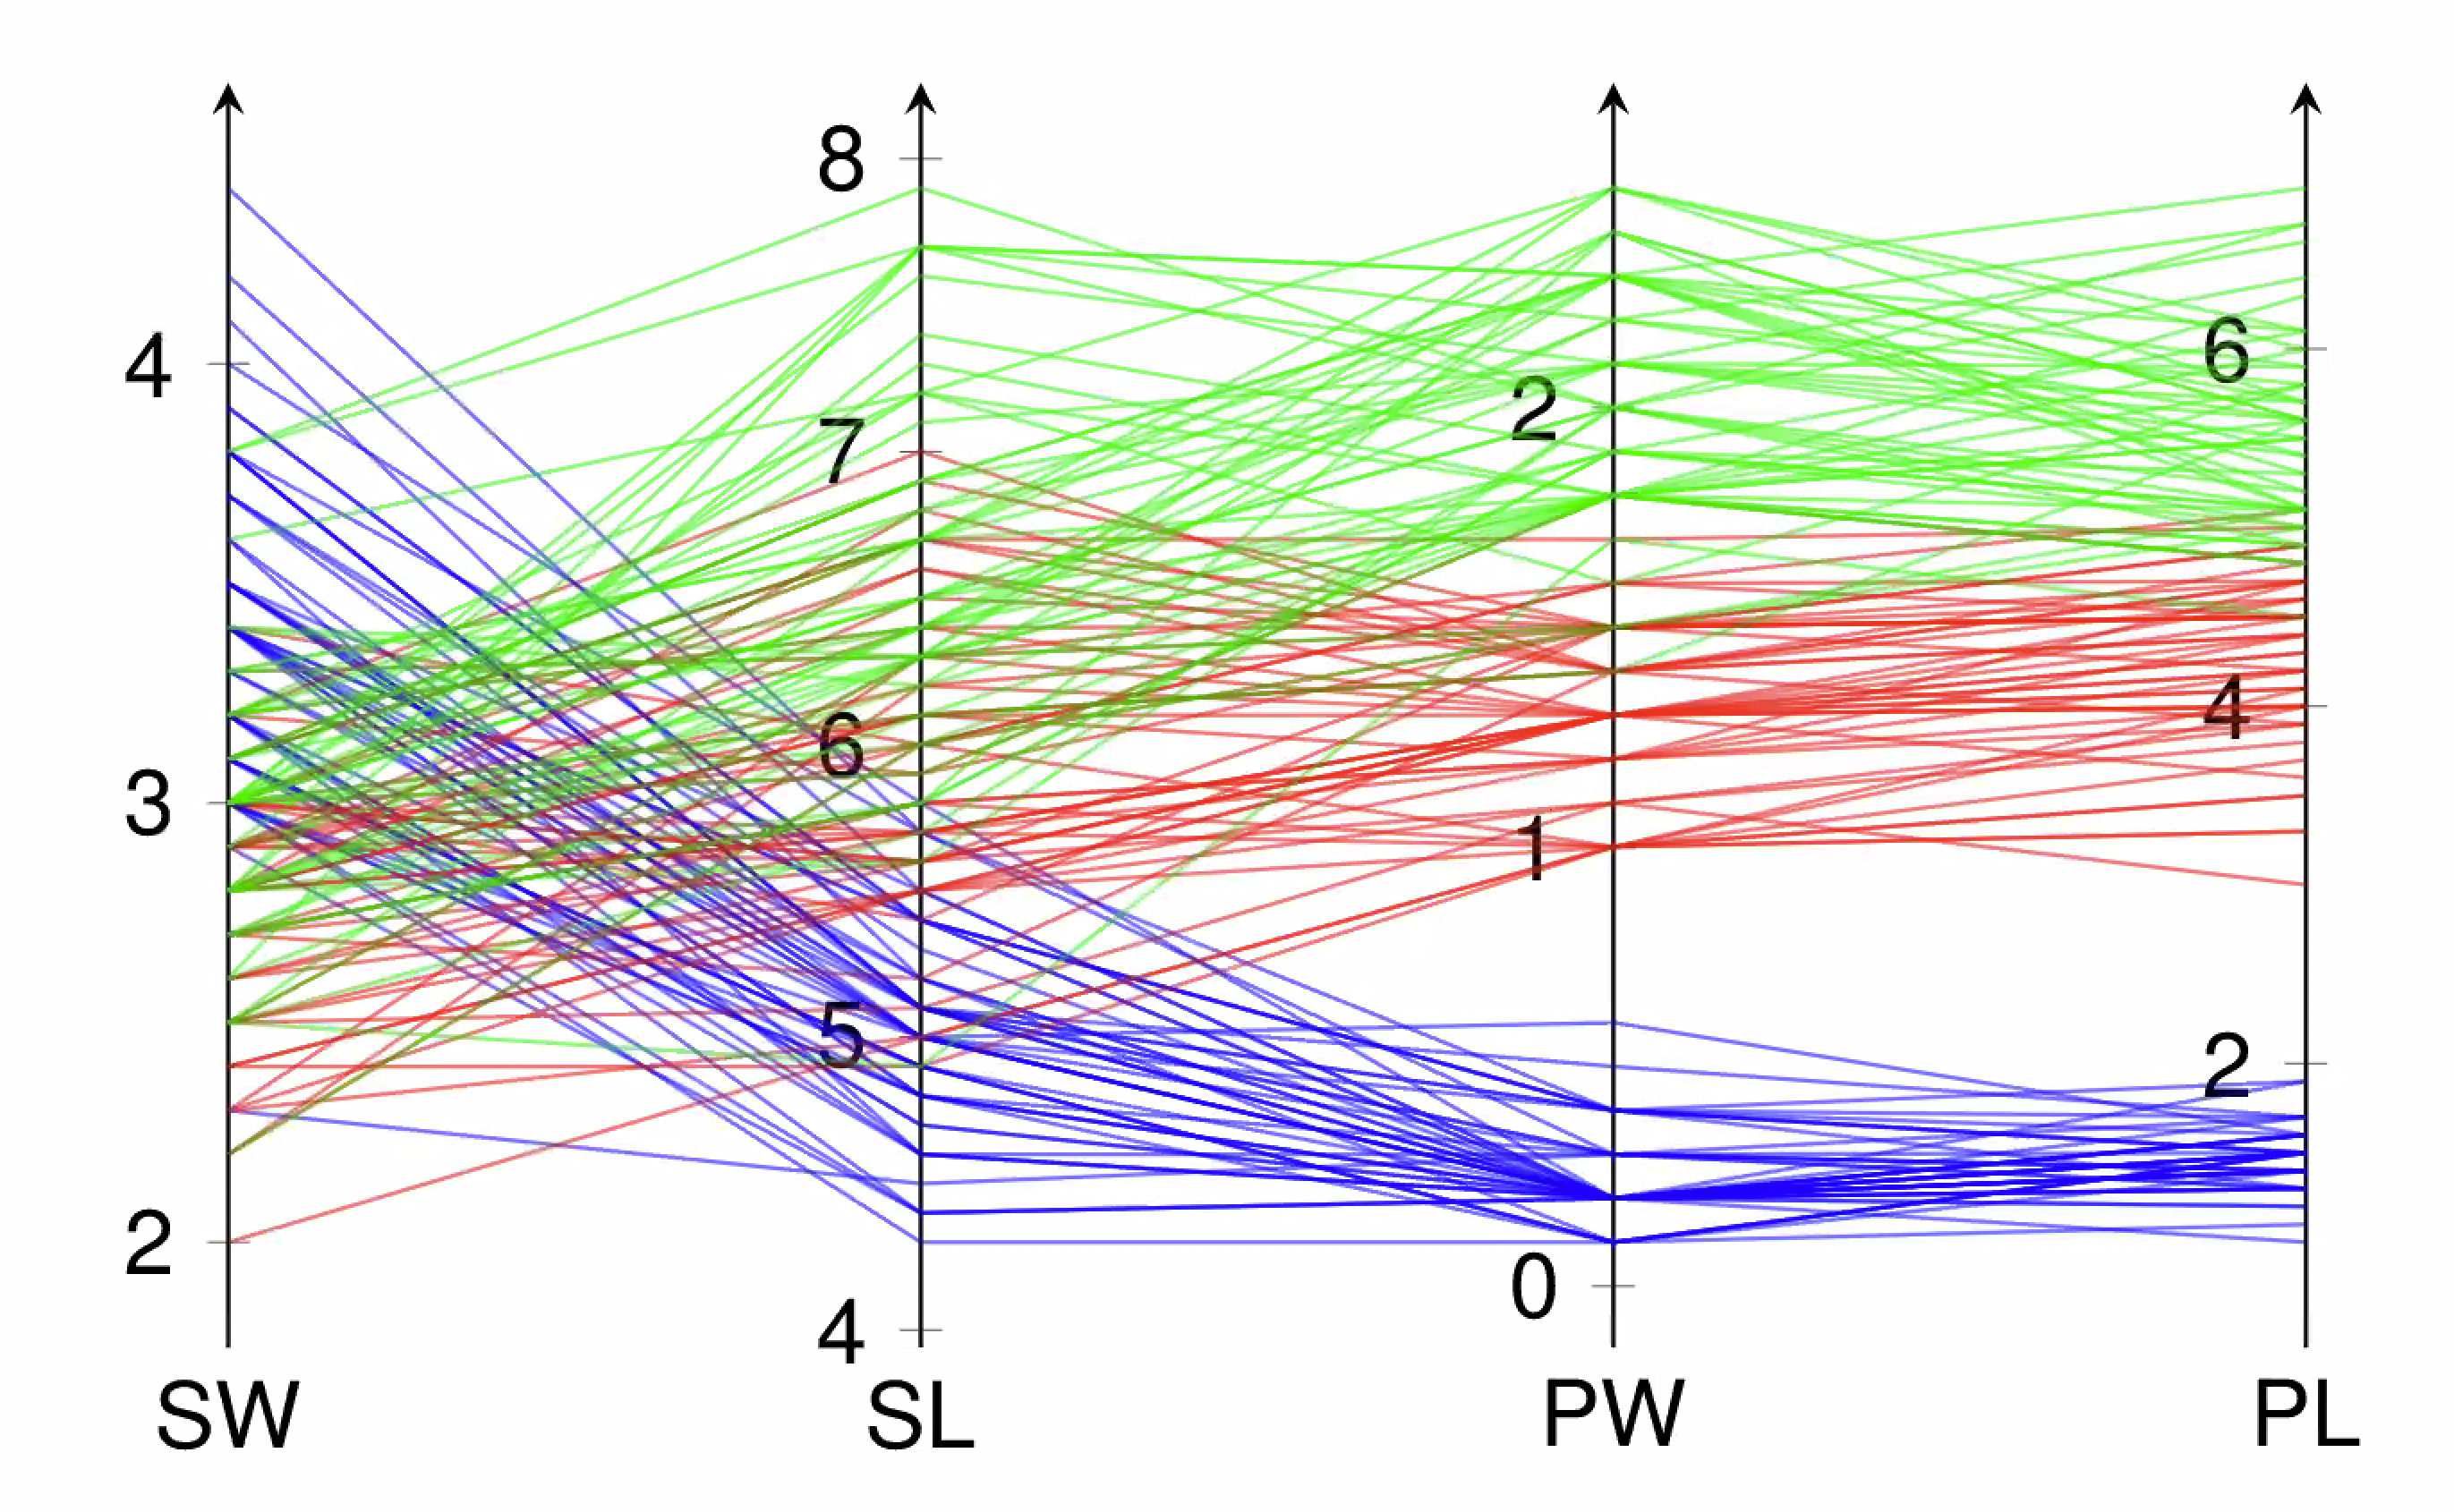
Parallel Coordinate Plot
Most used plot for Multivariate Dataset.
Can be used to select good Hyperparameters for a model if you plot all the Hyperparameters and the score of the model.
Interactions
Brushing:
- select range for a certain attribute
- reduces clutter
- can identify Correlation between attributes.
Select Axes:
- select only important variables
Permutation of the Axes:
- visualize Correlation
Disadvantages
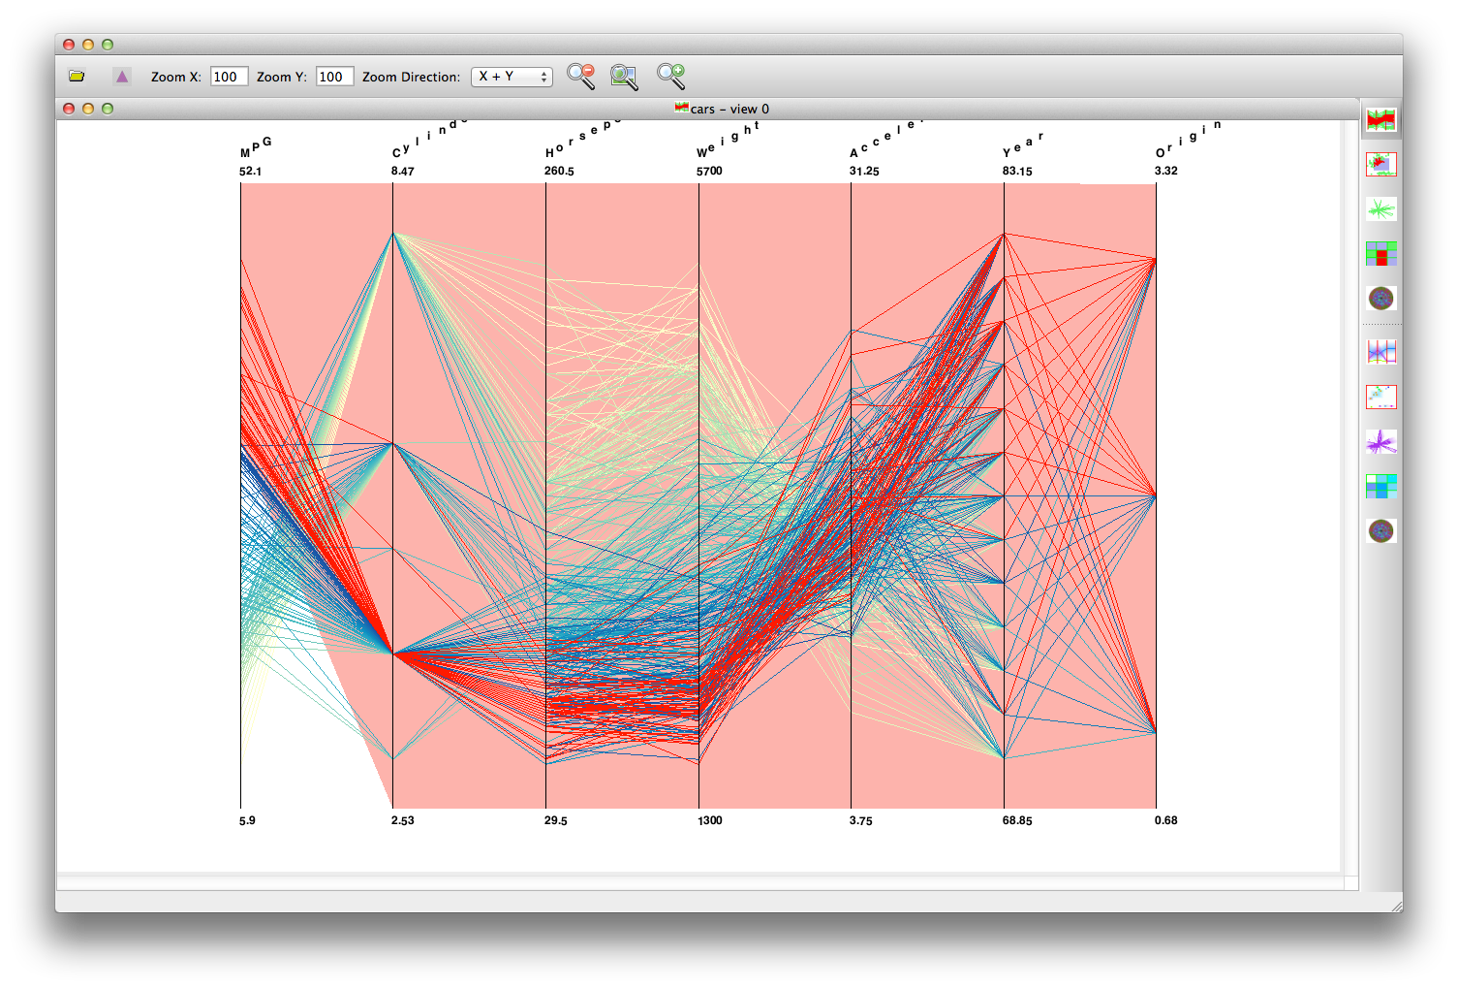
Reduced readability with a lot of data or more dimensions.
- partly resolved using Brushing
Example