Marcs Notes
Search
Suche
Dunkler Modus
Heller Modus
Explorer
Home
❯
university
❯
Data Science
❯
Data Visualization
❯
Heatmap
Heatmap
09. Juni 2026
1 Min. Lesezeit
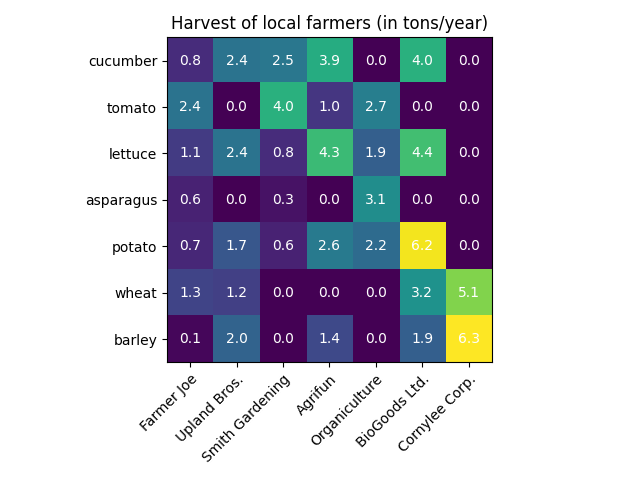
Heatmap
Similar to
Scatter Plot Matrices
if used to show
Correlation
.
Graphansicht
Backlinks
Scatter Plot Matrices
Accumulated Local Effect Plot
Partial Dependence Plot
Saliency Map