Correlation Analysis
Numerical data
→ Correlation, Covariance, Sample Covariance, Variance → Visual detection using Scatter Plot or Scatter Plot Matrices.
Nominal data
X = set of all distinct combinations of attributes Y = set of all tuples
Actual quantity:
Expected quantity in case of independence:
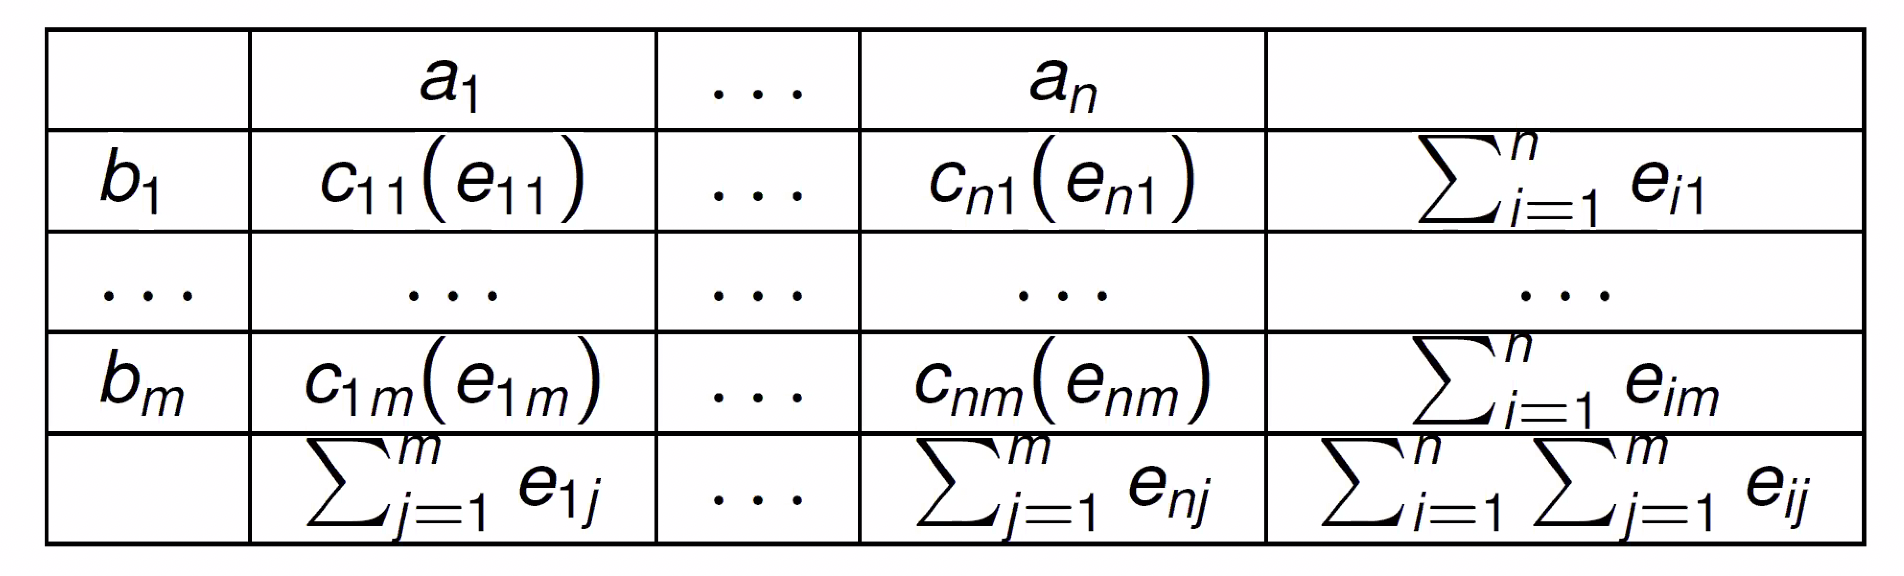
To determine Correlation you need to apply the Chi-Squared Test to the values in the table.
Python Implementation
def correlation(AS: pd.Series, BS: pd.Series):
    A = AS.unique()
    B = BS.unique()
    A = np.flip(A)
    B = np.flip(B)

    n = len(A)
    m = len(B)

    # Generate all possible combinations of values in A and B
    X = [(i, j) for i in A for j in B]
    Y = [(i, j) for i, j in zip(AS,BS)]

    nY = len(Y)

    def actual(i, j):
        count = 0
        for ab in Y:
            if ab[0] == i and ab[1] == j:
                count = count + 1
        return count

    def expected(i, j):
        s1 = sum([actual(i, k) for k in B])
        s2 = sum([actual(l, j) for l in A])
        return (s1 * s2) / nY

    # Calculate Expected and Actual matrices
    e_table = np.zeros((m,n))
    c_table = np.zeros((m,n))
    for i, b in enumerate(B):
        for j, a in enumerate(A):
            c = actual(a, b)
            e = expected(a, b)
            e_table[i, j] = e
            c_table[i, j] = c

    # Calculate Chi Squared Value
    chi = 0
    for i in range(n):
        for j in range(m):
            e = e_table[i, j]
            c = c_table[i, j]
            chi += (c - e)**2 / (e)

    return c_table, e_table, chi